Vikingen Maxi
Vikingen Maxi
Couldn't load pickup availability
Our best show. For those who can monitor the Swedish stock exchange during the day. A very, very high degree of profitable chance. This program is adapted for option traders. An autopilot chooses good options to sell and buy. Historical data shows at least 85% chance of making a profit, if you have the opportunity to carefully monitor the stock market. Vikingen Trading, stock and index options, special selections with car pilots and Black & Scholes tables.
Presentation of the Viking Maxi
Do you trade options? Thinking about exhibiting alternatives? Want to protect your portfolio? Do you want to make money regardless of how the stock market goes? In that case, Vikingen Option is a good program.
With Vikingen Option you get rates for Swedish shares and index options, unique option models, Black & Scholes, simple automatic searches and everything that is part of Vikingen Trading. In Vikingen Trading you have all stocks, indices, currencies, fundamentals, future alarms, etc. Possibility to write your own models.
There are very accurate models that have worked for a long time. Of course here are the Greeks like Delta, Gamma, Theta, Epsilon, Eta in tabular form for you to sort. The Viking Option contains the black & scholes formula where you can get the most affordable option right now. You can rank the table by the difference between theoretical value and actual value. Theoretical value is based on, among other things, number of days to maturity, implied volatility, historical volatility, etc. As you probably know, those who list the option (the issuer) are obliged to set prices if you so request. It is especially when you want to issue an option. In Vikingen Option you can see the theoretical purchase and sealing price. You don't need to calculate anything yourself.
You can create your own lists with the option you are interested in. Mix both options and index options. You can even get automatic alerts on days when a certain level for each option is broken. Either you draw trend lines yourself and order monitoring or you let Vikingen Option calculate the alarm levels.
Vikingen Option is our most complete program and also the simplest. How is that possible? We've already done most of the work for you, you just need to start a program we call "Autopilot", and it automatically provides new signals and future alarm levels. It is good to have a fast computer if you want to work with future signals. We call future signals tomorrow's signals. There will be many calculations for the thousands of options available.
It's that simple.
- Start the Viking
- Update courses
- Click Autopilot and autopilot O_optio2.
- Options to buy, sell or exhibit are suggested on the screen.
The historical accuracy is very high for issued options. The person exhibiting has time with them, the person buying options has time against them.
Put options, bought options are the easiest to make money when the underlying security or index moves very quickly ie. when volatility is unusually high. The unique optional model in the Viking also has high accuracy on purchased options, but this places higher demands on the user. For purchased options, it's a high adrenaline factor, but should sit there and watch during the day. Of course, there is a chance that with a little money you can earn a lot, but it also goes quickly the other way. The bank may tell you: you can only lose what you bet. It's true, the problem is that you bet multiple times and in the end the money may be gone.
But ... then everyone should issue, i.e. sell, options. Well, if only it were that simple. For example, if you sign 10 contracts in Volvo, 1 block, you have an obligation to fulfill your promise to buy 10 times 100 shares within the term has expired. If Volvo goes down, you must be prepared to buy shares or buy back the issued option at a loss. Say you issued for SEK 150, then you must be prepared to buy for SEK 150,000. Your bank continuously checks for any danger and will contact you if they see that the risk is increasing. You must have a certain amount of security in your account to be able to issue, it is usually around 10%, so I give an example of SEK 15,000. The security amount changes every day. Even the bank does not know how much the security amounts are for all options, but asks the exchange itself about it. In the past it has changed every other day.
Of course, nothing can be promised, but here is a good method That is, a suggestion on how to find the best options to bet on.
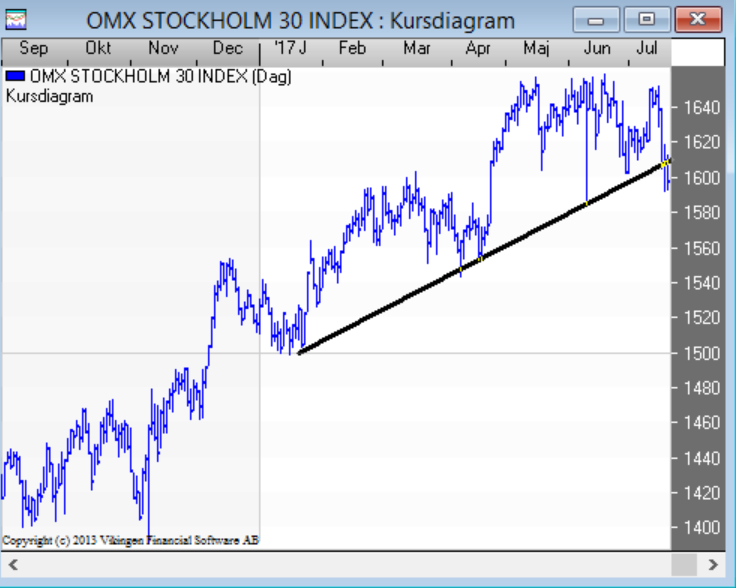
- How is the stock market as a whole? Look at the OMXS30 index. If the index has broken a trend, support or resistance, the stock is overbought or oversold. Preferably trade in the direction of the stock exchange.
Bring up a chart on OMXS30, pull in trend/support/resistance. Here, for example, OMX has broken an upward trend and your strategy will probably be that the stock market falls, bet in that direction. For example, issuing call options in shares.
- Review the stocks that have options. Who has reached their resistance, who is going down? Who has the bottom until the next support?
For example Volvo B. Here the share has broken both the medium and short term trend. Acts as an extra strong signal.
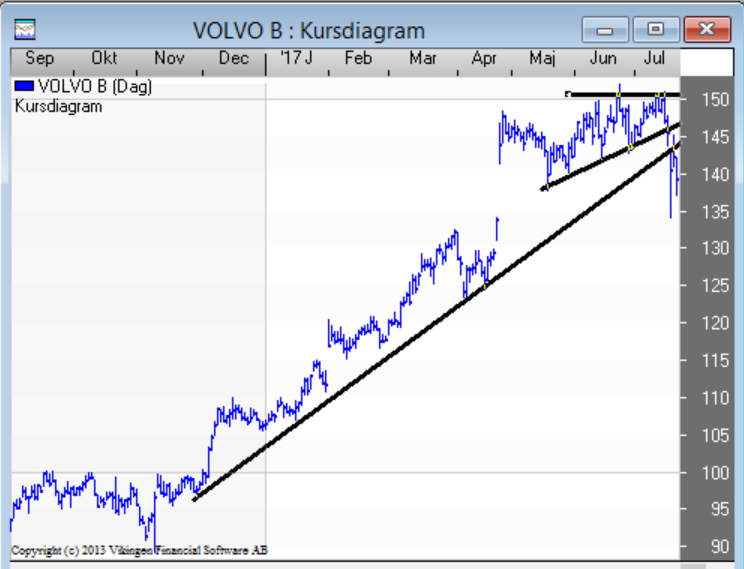
- A suitable call option to issue? 150 feels very safe, but is probably too far from current pace, so par. The closer you get to par, the more money you get, but you run the risk of someone wanting to buy your Volvo island. Of course, you get most of the money if you issue "In the money", that is, the option has a real value. Say the price is 140 above, and you bet on putting and calling the 140 option. The real value of the option will then be SEK 0 (minus brokerage). The expectation value is added.
- Find the option in Viking, Since we are quite a few weeks into July, you probably choose September as redemption There should be at least 3 weeks left until redemption. The expected value drops drastically if there are less than 3 weeks left. Find out which letter the ransom month September has, i.e. the ninth letter in the alphabet: I. The alternative is then called VOLVB7I140.
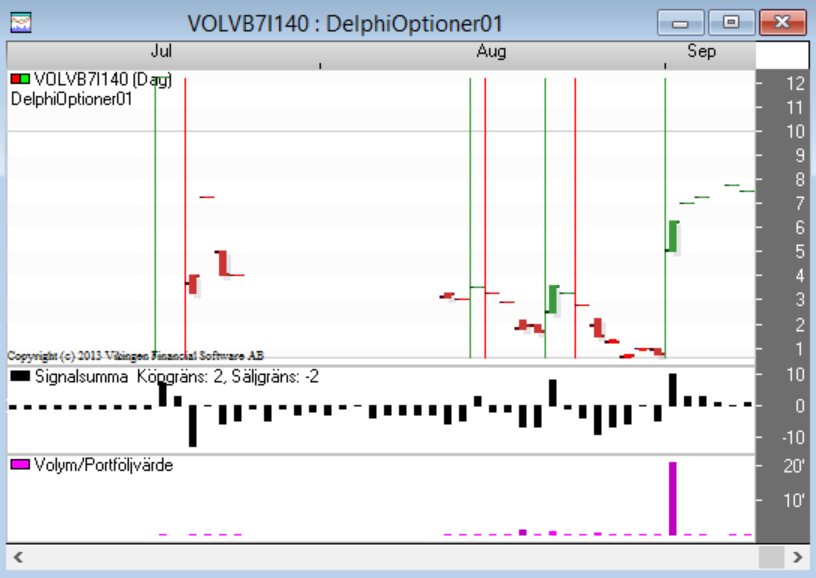
- Look for buy and sell signals
You pick up an option model and see that you only got a sell signal of SEK 4 and issue.
- Monitor the option and buy back when you get a buy signal. Here it was 3.50, i.e. a profit of 50 cents. 0.5 / 4 = 12.5%. Decent for a month. ATTENTION! With alternatives, things go quickly, many times in the wrong direction. For example in August where you received 3 KR, but had to buy back for 6 KR. Here the important thing is to follow the underlying stock. If it starts to rise, it is good to buy back the option. Tip; Accepting the purchase price contained within it gets worse.
There are many ways, often called strategies. Among the most common are sold ostrich or sold cradle, bought ostrich or bought cradle. It's about buying options with different passwords. This increases the cost and reduces the revenue (premium) but risks a decrease. Vikingen Option does not calculate strategies. What you can do instead is run the O_Optio2 autopilot that is in Viking and invest in several options that have a signal. Then you spread the risks. Of course, you can still make a loss, but the chance of winning increases. A good tip is to settle for a certain profit, e.g. 30% and keeps the losses short, e.g. not lower than 15% loss.
The unique signal table with high accuracy
Below is an excerpt from the signal table in Vikingen. The "Current Purchase Age" column tells you how many days ago there was a signal. The "% from signal" column indicates how things have gone since then. If it is a buy signal, it should preferably be a plus, a minus sign means a loss (i.e. decrease in value). As you can see below, almost everyone has agreed wisely… but you may have had the bad luck to bet on those who have lost.
| Object | Current purchase age | Current sales age | % from Signal | Signal sum | Last | Volume | Date |
| BOLI7L280 | 26 | 195.65 | 6 | 17 | 15 | 170908 | |
| ELUXB7U280 | 19 | 63.79 | 9 | 4.75 | 50 | 170908 | |
| ERICB7V50 | 14 | 58.73 | 7 | 5 | 30 | 170908 | |
| HMB8O250 | 13 | 14.43 | 5 | 55.5 | 25 | 170908 | |
| ERICB7U46 | 8 | 27,27 | 0 | 0.7 | 10 | 170908 | |
| SAND7L130 | 8 | 34.62 | 7 | 8.75 | 14 | 170908 | |
| AZN7L510 | 6 | 175 | 3 | 16.5 | 10 | 170908 | |
| HMB7X230 | 6 | -1.38 | 1 | 35.75 | 74 | 170908 | |
| SSABA7I38 | 6 | 55.1 | 7 | 3.8 | 186 | 170908 | |
| SHBA7U125 | 6 | 72,73 | 5 | 9.5 | 10 | 170908 | |
| SSABA7I40 | 5 | 28.57 | 5 | 1.8 | 2210 | 170908 | |
| VOLVB7L145 | 5 | 158.33 | 6 | 7.75 | 50 | 170908 | |
| EKTAB7I80 | 5 | 6.25 | 3 | 4.25 | 5 | 170908 | |
| VOLVB7I140 | 5 | 20 | 1 | 7.5 | 50 | 170908 | |
| VOLVB7I142.50 | 5 | 10.53 | 1 | 5.25 | 10 | 170908 | |
| ATCOA7L330 | 5 | 7.14 | 4 | 7.5 | 5 | 170908 | |
| ALPHA7J185 | 3 | 54.41 | 4 | 5.25 | 16 | 170908 | |
| AZN7I470 | 3 | 115.25 | -1 | 31.75 | 12 | 170908 | |
| EKTAB7J85 | 3 | 73.91 | 4 | 2 | 40 | 170908 | |
| EKTAB7L90 | 3 | 20 | 5 | 1.8 | 20 | 170908 | |
| AZN7J510 | 2 | 186.76 | 5 | 9.75 | 10 | 170908 | |
| AZN7I500 | 2 | 520.69 | 4 | 9 | 10 | 170908 | |
| HMB8C230 | 2 | 5.26 | 3 | 4 | 50 | 170908 | |
| HMB7J210 | 2 | 15.94 | 3 | 4 | 5 | 170908 | |
| HMB7L200 | 2 | 11,11 | 3 | 10 | 10 | 170908 | |
| FINGB7U34 | 2 | -20.83 | 2 | 1.9 | 25 | 170908 | |
| FINGB7U33 | 2 | -12.5 | -1 | 1.4 | 10 | 170908 |
When the buy signal is sharp, it should read "0" in columns for "Current buy sale".
| Object | Current purchase age | SignalSignal sum | Last | Volume | Date | ||
| ICA7L330 | 0 | 2 | 4.5 | 20 | 170908 | ||
| SSABA7L38.24X | 0 | 6 | 4.5 | 40 | 170908 | ||
| HMB7J195 | 0 | 3 | 10.75 | 10 | 170908 | ||
| KINB8O230 | 0 | 4 | 8.5 | 100 | 170908 | ||
| HMB7J230 | 0 | 3 | 0.85 | 10 | 170908 | ||
| SSABA7I42 | 0 | 3 | 0.45 | 513 | 170908 |
On the day when it is time to sell according to models, "0" should be written in columns for "Current Selling Age"
| Object | Current purchase age | Current sales age | % from Signal | Signal sum | Last | Volume | Date |
| OMXS307V1560 | 1 | 6.06 | -1 | 35 | 165 | 170908 | |
| OMXS307V1600 | 1 | 0 | -2 | 59.5 | 2 | 170908 | |
| HMB7U200 | 1 | -3.92 | -3 | 2.45 | 30 | 170908 | |
| OMXS308O1500 | 1 | -0.89 | -4 | 55.75 | 13 | 170908 | |
| OMXS307X1360 | 1 | -8.57 | -5 | 8 | 360 | 170908 | |
| SKFB7K170 | 1 | -15.56 | -3 | 1.9 | 22 | 170908 | |
| OMXS307U1600 | 1 | -2.25 | -3 | 54.25 | 5 | 170908 | |
| SKAB7J185 | 1 | 11.76 | -1 | 1.9 | 40 | 170908 | |
| VOLVB7J155 | 0 | -2 | 2 | 43 | 170908 | ||
| HMB7U225 | 0 | -7 | 24 | 10 | 170908 | ||
| HMB7I205 | 0 | -3 | 2.15 | 397 | 170908 | ||
| HMB7J205 | 0 | -3 | 6.25 | 10 | 170908 |
In Vikingen Option you also get an option table according to Black & Scholes. This is how it might look:
(everything didn't add up, that among more Greeks implicit values, theoretical value, difference, etc...)
| Object | Diff | Diff (%) | Last | Volume | Date of passport | Time | Participate | Gamma |
| OMXS307I08Y1570 | -0.35 | -77.78 | 0.1 | 5 | 2017-09-08 | 2017-09-08 | ||
| OMXS307I1500 | 9 | 21.69 | 50.5 | 1 | 2017-09-15 | 2017-09-08 | 0.98 | 0 |
| OMXS307I1530 | 4.25 | 21.52 | 24 | 8 | 2017-09-15 | 2017-09-08 | ||
| OMXS307I1540 | -0.25 | -1.43 | 17.25 | 10 | 2017-09-15 | 2017-09-08 | 0.7 | 0.01 |
| OMXS307I1545 | -1.5 | -9.38 | 14.5 | 35 | 2017-09-15 | 2017-09-08 | 0.62 | 0.01 |
| OMXS307I1550 | -1 | -8 | 11.5 | 209 | 2017-09-15 | 2017-09-08 | ||
| OMXS307I1555 | -1 | -10 | 9 | 48 | 2017-09-15 | 2017-09-08 | 0.46 | 0.02 |
| OMXS307I1560 | -0.75 | -9.68 | 7 | 92 | 2017-09-15 | 2017-09-08 | 0.38 | 0.01 |
| OMXS307I1565 | 0.25 | 5.26 | 5 | 23 | 2017-09-15 | 2017-09-08 | 0.31 | 0.01 |
| OMXS307I1570 | -0.8 | -17.78 | 3.7 | 413 | 2017-09-15 | 2017-09-08 | ||
| OMXS307I1580 | -0.7 | -28.57 | 1.75 | 186 | 2017-09-15 | 2017-09-08 | 0.14 | 0.01 |
| OMXS307I1585 | -0.2 | -12.5 | 1.4 | 3 | 2017-09-15 | 2017-09-08 | 0.1 | 0.01 |
| OMXS307I1590 | -0.2 | -16.67 | 1 | 411 | 2017-09-15 | 2017-09-08 |